

Introduction
In the first part of this article, we covered how to assemble the hardware of our Kubernetes cluster using a Turing Pi 2 board with 4 Raspberry Pi Compute Module 4 units. We installed DietPi as the operating system on each node and connected an SSD to node 3 via the SATA port.
If you’ve followed all the steps from Part 1, you should now have:
- The BMC active and configured
- All 4 nodes accessible via SSH
- A physical cluster ready to host the software infrastructure
In this second part, we will focus on configuring the Kubernetes cluster, starting with the installation of K3s and integrating essential tools for management, monitoring, and application deployment.
Objectives
In this second part, we’ll focus on configuring the software environment of our cluster. The goal is to create a complete, functional Kubernetes cluster ready to manage applications in a modern and modular way.
Specifically, we will:
- Install K3s to set up a lightweight and efficient Kubernetes cluster
- Install and configure Helm, the package manager for Kubernetes
- Set up MetalLB as a load balancer to assign public IPs in the cluster
- Install ArgoCD to manage GitOps-based application deployment
- Integrate Prometheus for cluster monitoring
- Add Grafana to visualize metrics through dashboards
At the end of this guide, your cluster will be ready to manage production-grade applications (or nearly 😄), and you’ll be able to start experimenting with the Kubernetes ecosystem.
Prerequisites
Before installing the Kubernetes cluster, we need to complete some system configurations on each node.
Enable cgroups
To allow Kubernetes (and thus K3s) to function correctly, you need to enable cgroups in the kernel.
-
SSH into each node.
-
Edit the file
/boot/cmdline.txtby adding the following to the end of the line (everything must stay on one line):cgroup_enable=cpuset cgroup_enable=memory cgroup_memory=1 -
Reboot each node to apply the change. If you’re using BMC with the
tpitool, you can do:tpi power off -n 1 tpi power on -n 1Repeat for each node (
-n 2,-n 3, etc.).
Set Hostnames
Assign a unique hostname to each node. I chose the following names:
- cube01
- cube02
- cube03
- cube04
You can change them via:
dietpi-config > Security Options > Hostname
Update the Operating System
On each node, run:
apt update
apt upgrade
Configure /etc/hosts
Update the /etc/hosts file on each node with the static IPs and assigned hostnames. This allows you to use hostnames instead of IP addresses.
Example:
192.168.1.178 cube01
192.168.1.180 cube02
192.168.1.177 cube03
192.168.1.187 cube04
Install a Basic Firewall
Install a basic firewall (iptables) on each node:
apt -y install iptables
Installing Kubernetes with K3s
To install Kubernetes, we’ll use K3s, a lightweight distribution designed for resource-constrained environments like Raspberry Pi, but without sacrificing core Kubernetes functionality.
Control Plane Installation
On node cube01 (or the one you’ve chosen as master), run:
curl -sfL https://get.k3s.io | sh -s - \
  --write-kubeconfig-mode 644 \
  --disable servicelb \
  --token myrandompassword \
  --node-ip 192.168.1.178 \
  --disable-cloud-controller \
  --disable local-storage
Note: Replace myrandompassword with a secure token and save it—you’ll need it to join other nodes.
Explanation of options:
--write-kubeconfig-mode 644: makes the kubeconfig file readable by other users (e.g., Rancher)--disable servicelb: disables the built-in service load balancer as we’ll use MetalLB--token: custom token to allow other nodes to join the cluster--node-ip: local IP of the node (adjust to your setup)--disable-cloud-controller: disables the cloud controller, not needed in bare-metal setups--disable local-storage: disables K3s local storage — we’ll use NFS instead
Verify
After installation, verify the master node status with:
kubectl get nodes
Expected output:
NAME     STATUS   ROLES                       AGE     VERSION
cube01   Ready    control-plane,master        6m22s   v1.25.6+k3s1
Worker Node Installation
To join the other nodes (e.g., cube02, cube03, cube04) to the control plane, run this on each node:
curl -sfL https://get.k3s.io | K3S_URL=https://192.168.1.178:6443 K3S_TOKEN=myrandompassword sh -
Replace:
192.168.1.178with the IP of the master nodemyrandompasswordwith the token used earlier
After a few seconds, you should see the nodes join the cluster. Verify from the master node:
kubectl get nodes
Example output:
NAME     STATUS   ROLES                       AGE     VERSION
cube01   Ready    control-plane,master        10m     v1.25.6+k3s1
cube02   Ready    <none>                      2m      v1.25.6+k3s1
cube03   Ready    <none>                      2m      v1.25.6+k3s1
cube04   Ready    <none>                      1m      v1.25.6+k3s1
Label the Nodes
Optional but recommended: labeling nodes allows Kubernetes to assign custom roles, enabling better workload distribution.
kubectl label nodes cube01 kubernetes.io/role=worker
kubectl label nodes cube02 kubernetes.io/role=worker
kubectl label nodes cube03 kubernetes.io/role=worker
kubectl label nodes cube04 kubernetes.io/role=worker
To verify:
kubectl get nodes --show-labels
Installing Helm
Helm is the go-to package manager for Kubernetes. It allows you to install, update, and manage complex applications through simple commands and configuration files called charts.
Manual Installation on cube01 (master)
-
Install Git (required for some Helm charts):
apt -y install git -
Configure the kubeconfig file:
export KUBECONFIG=~/.kube/config mkdir -p ~/.kube sudo k3s kubectl config view --raw > "$KUBECONFIG" chmod 600 "$KUBECONFIG" echo "KUBECONFIG=$KUBECONFIG" >> /etc/environment -
Download and install Helm:
cd ~ mkdir helm cd helm curl -fsSL -o get_helm.sh https://raw.githubusercontent.com/helm/helm/main/scripts/get-helm-3 chmod 700 get_helm.sh ./get_helm.sh -
Verify the installation:
helm version
Networking with MetalLB
MetalLB is a load balancer for bare-metal environments, allowing you to expose Kubernetes services using assignable IP addresses in your local network. It’s essential if you want to access your services externally without a cloud provider.
Installing MetalLB
On the master node (cube01):
-
Add the MetalLB Helm repository:
helm repo add metallb https://metallb.github.io/metallb helm repo update -
Confirm the chart is available:
helm search repo metallb -
Install MetalLB:
helm upgrade --install metallb metallb/metallb --create-namespace \
  --namespace metallb-system --wait
Configure the IP Address Pool
Assign an IP range for MetalLB to use. Adjust based on your network setup and make sure these IPs are not used by other devices.
cat << 'EOF' | kubectl apply -f -
apiVersion: metallb.io/v1beta1
kind: IPAddressPool
metadata:
  name: default-pool
  namespace: metallb-system
spec:
  addresses:
  - 192.168.1.240-192.168.1.250
---
apiVersion: metallb.io/v1beta1
kind: L2Advertisement
metadata:
  name: default
  namespace: metallb-system
spec:
  ipAddressPools:
  - default-pool
EOF
Verify
You should see:
ipaddresspool.metallb.io/default-pool created
l2advertisement.metallb.io/default created
Storage Configuration with NFS
To handle persistent storage in the cluster, this setup uses an NFS server based on an SSD connected to the SATA port on node 3 (cube03). This allows you to centralize shared volumes for use in Kubernetes pods.
Identify the Disk
SSH into cube03 and run:
fdisk -l
Example output:
Disk /dev/sda: 931.51 GiB, 1000204886016 bytes, 1953525168 sectors
Disk model: CT1000BX500SSD1
Format and Mount the Disk
Format the disk as ext4:
mkfs.ext4 /dev/sda
Create a mount point and configure automatic mounting:
mkdir /data
echo "/dev/sda /data ext4 defaults 0 0" | tee -a /etc/fstab
mount -a
Verify the mount:
df -h /data
Install and Configure the NFS Server
Install the NFS server package:
apt install -y nfs-server
Export the /data directory:
echo "/data *(rw,no_subtree_check,no_root_squash)" | tee -a /etc/exports
Enable and start the NFS service:
systemctl enable --now nfs-server
Reload and re-export:
exportfs -ar
Verify:
showmount -e localhost
Install the NFS Client on Other Nodes
On nodes cube01, cube02, and cube04:
apt install -y nfs-common
Your cluster can now use /data as shared storage via NFS.
Installing the NFS StorageClass
In Kubernetes, a StorageClass defines the type of storage that can be dynamically provisioned for pods. It is an abstraction layer that allows the creation of Persistent Volumes (PV) automatically when an application requests a Persistent Volume Claim (PVC).
Key Concepts
- Persistent Volume (PV): a portion of storage in the cluster, either statically or dynamically provisioned.
- Persistent Volume Claim (PVC): a request by an application for a specific type and amount of storage.
- StorageClass: defines how a PV should be created based on a PVC request.
Relationship:
PVC ➜ requests storage ➜ StorageClass ➜ defines how it's created ➜ PV ➜ is assigned
The Provisioner: nfs-subdir-external-provisioner
To use NFS in our cluster, we’ll install the nfs-subdir-external-provisioner, a controller that automatically manages subfolders in an NFS export for each PVC request.
Install via Helm
Run on the master node (cube01):
helm repo add nfs-subdir-external-provisioner https://kubernetes-sigs.github.io/nfs-subdir-external-provisioner/
helm repo update

helm install nfs-subdir-external-provisioner nfs-subdir-external-provisioner/nfs-subdir-external-provisioner \
  --set nfs.server=192.168.1.177 \
  --set nfs.path=/data \
  --create-namespace \
  --namespace nfs-system
Verify the StorageClass
After installation, verify:
kubectl get storageclass
Example output:
NAME           PROVISIONER                                  RECLAIMPOLICY   VOLUMEBINDINGMODE   ALLOWVOLUMEEXPANSION   AGE
nfs-client     cluster.local/nfs-subdir-external-provisioner   Delete          Immediate           true                  10m
Installing ArgoCD
ArgoCD is a DevOps tool for Kubernetes that enables the GitOps model: applications are defined as code in a Git repository and ArgoCD automatically syncs and deploys them in the cluster.
Installation
Run on the master node (cube01):
kubectl create namespace argocd
kubectl apply -n argocd -f https://raw.githubusercontent.com/argoproj/argo-cd/stable/manifests/install.yaml
Wait until all pods are in Running state:
kubectl get pods -n argocd
Expected output:
NAME                                             READY   STATUS    RESTARTS   AGE
argocd-application-controller-0                  1/1     Running   0          3d
argocd-applicationset-controller-xxx             1/1     Running   0          3d
argocd-dex-server-xxx                            1/1     Running   0          3d
argocd-notifications-controller-xxx              1/1     Running   0          3d
argocd-redis-xxx                                 1/1     Running   0          3d
argocd-repo-server-xxx                           1/1     Running   0          3d
argocd-server-xxx                                1/1     Running   0          3d
Retrieve the Login Password
kubectl -n argocd get secret argocd-initial-admin-secret -o jsonpath="{.data.password}" | base64 -d; echo
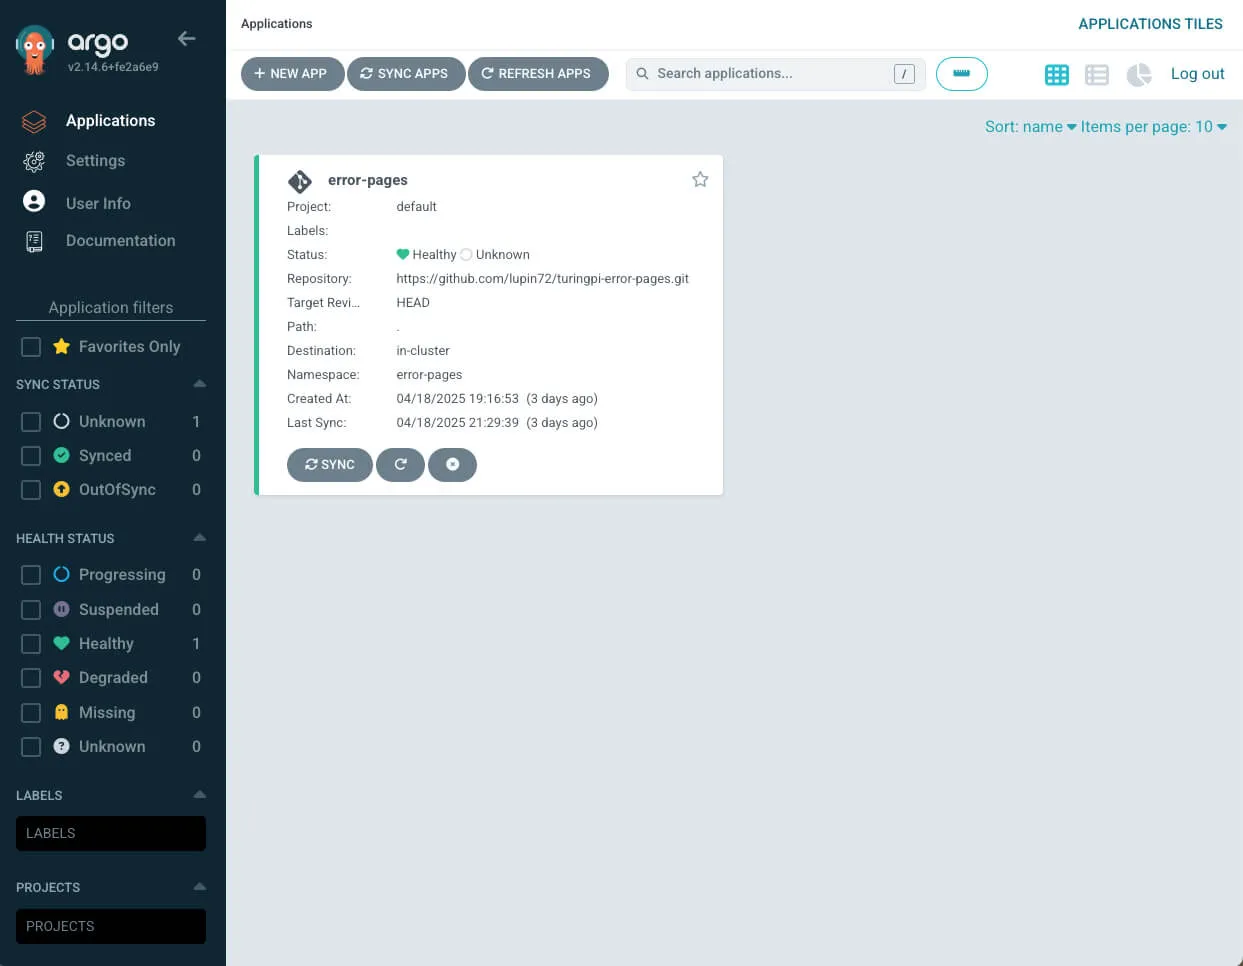
Accessing the UI via MetalLB
Expose ArgoCD’s web interface using a LoadBalancer:
kubectl patch service argocd-server -n argocd --patch '{ "spec": { "type": "LoadBalancer", "loadBalancerIP": "192.168.1.242" } }'
Check:
kubectl get svc -n argocd
Installing Prometheus and Grafana
Prometheus is a monitoring and alerting system developed by SoundCloud and now part of the CNCF. It is designed to collect metrics from cloud-native environments like Kubernetes.
Grafana, integrated into this stack, enables visualization of metrics via interactive, customizable dashboards.
Installation
On the master node (cube01), run:
helm repo add prometheus-community https://prometheus-community.github.io/helm-charts
helm repo update

helm install prometheus prometheus-community/kube-prometheus-stack \
  --namespace monitoring \
  --create-namespace \
  --set prometheus.prometheusSpec.storageSpec.volumeClaimTemplate.spec.storageClassName=nfs-client \
  --set prometheus.prometheusSpec.storageSpec.volumeClaimTemplate.spec.resources.requests.storage=2Gi \
  --set grafana.persistence.enabled=true \
  --set grafana.persistence.storageClassName=nfs-client \
  --set grafana.persistence.size=2Gi
Verify
kubectl get pods -n monitoring
Retrieve Grafana Admin Password
kubectl get secret --namespace monitoring prometheus-grafana -o jsonpath="{.data.admin-password}" | base64 -d; echo
Accessing Grafana via MetalLB
Expose Grafana via a LoadBalancer IP:
kubectl patch svc prometheus-grafana -n monitoring \
  --patch '{ "spec": { "type": "LoadBalancer", "loadBalancerIP": "192.168.1.243" } }'
Check:
kubectl get svc -n monitoring
Creating Monitoring Dashboards
- Log in to the Grafana web UI
- Enter the admin credentials and change the password if prompted
Add Prometheus as a Data Source
Go to: Connections → Data sources and add a new source:
- Type: Prometheus
- URL: http://prometheus-kube-prometheus-prometheus.monitoring.svc.cluster.local:9090
Click Save & Test.
Import Preconfigured Dashboards
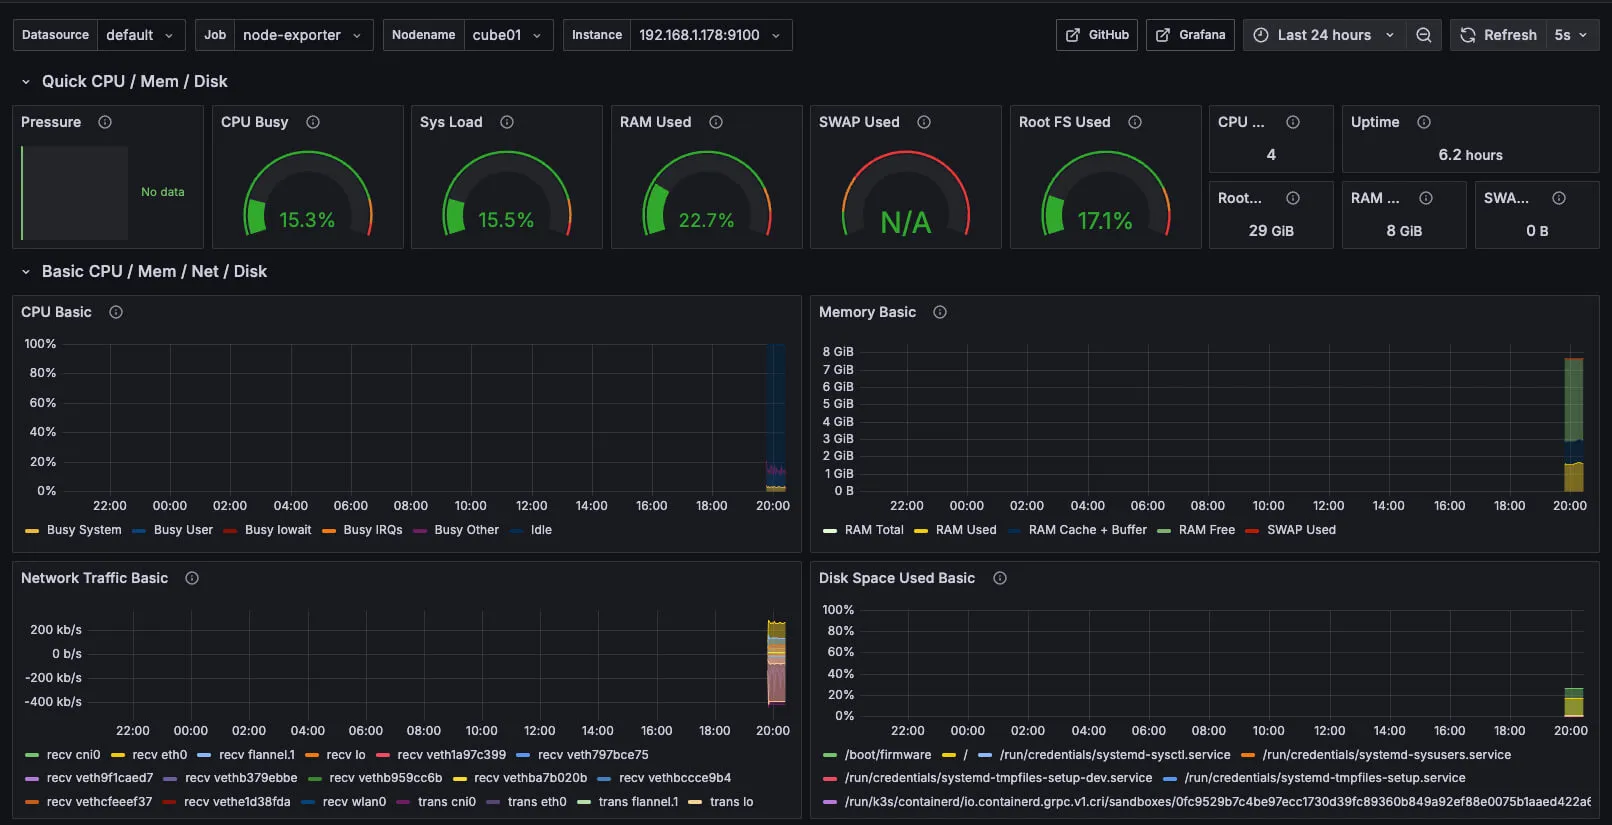
Node Monitoring Dashboard
Go to: Dashboard → New → Import and enter the ID: 1860
K3s Cluster Monitoring Dashboard
Import using ID: 15282
You now have full visibility into CPU, RAM, storage, traffic, and cluster health directly from Grafana.
Conclusion
At this point, your Kubernetes cluster based on Turing Pi 2 and Raspberry Pi CM4 is complete and fully operational, with all essential components for modern application management:
- K3s as a lightweight and reliable Kubernetes distribution
- Helm to simplify installation and management of services
- MetalLB for exposing services in bare-metal environments
- NFS as shared persistent storage
- ArgoCD for GitOps-based application deployment
- Prometheus and Grafana for monitoring and visualizing metrics
This setup provides a solid foundation to experiment with Kubernetes, automate application delivery, monitor system health, and easily scale new features.